Magda Ruxandra Mirescu1, Camelia Nicolae2, Gabriela Gheorghe2, Ana Ciobanu2, Andreea Hodorogea2, Simona Almarichi3, Sorina Onceanu2, Carmen Ginghina4, Ion Țintoiu5, Ioan Tiberiu Nanea2
1 “Carol Davila” University of Medicine and Pharmacy, Department of Internal Medicine Saint John Hospital Bucharest
2 “Carol Davila” University of Medicine and Pharmacy, Department of Cardiology, “Theodor Burghele” Hospital Bucharest
3 Department of Cardiology Army Emergency Center of Cardiology Bucharest
4 “Carol Davila” University of Medicine and Pharmacy, Department of Cardiology, Institute of Emergency for Cardiovascular Diseases “ Prof.C.C Iliescu”, Bucharest
5 “Carol Davila” University of Medicine and Pharmacy, Department of Cardiology Department of Cardiology Army Emergency Center of Cardiology Bucharest
Contact address:
Mirescu Magda Ruxandra, 13 Vitan-Bârzești Street, Bucharest, Romania. E-mail: magda_mirescu31@yahoo.com
Abstract: Objectives – Electrocardiogram (ECG) remains a landmark concerning ST segment elevation myocardial infarction (STEMI) diagnostic and prognostic, offering data for optimizing treatment strategy. The trial quantified ischemic lesions (ST segment) and loss of myocardial mass (R wave) during the optimal therapeutic decision interval. Methods – ST segment elevation magnitude and R wave amplitude correlated with pain onset–presentation interval were measured for 100 STEMI patients with TIMI 0/1 flow. Results – The ST magnitude during the 0-30 minutes’ interval displayed substantial variability (increasing 46.16%, stationary 30.87%, decreasing 22.96%). The R wave amplitude emphasized a mostly decreasing tendency (74.82% of cases) or remained stationary (25.18%). During the optimal therapeutic decision interval, a statistically significant correlation was established between the ST segment elevation magnitude (increasing, stationary or decreasing) and the decreasing R wave amplitude (r=0.45, p<0.0001; r=0.29, p<0.001; r=0.22, p<0.001). Conclusions – R wave amplitude analysis might be included in the electric description of STEMI, preserving a relation not only with the ST segment elevation rise but also with its’ decrease or constant levels. An eventual correlation between the R wave reduction and the ST segment elevation could suggest a necrosis’ evolution and may represent an additional useful parameter while setting the indication for reperfusion treatment.
Keywords: ST segment; R wave; optimal therapeutic decision interval; pain onset-presentation interval.
Abstract: Obiectivele – Electrocardiograma (ECG) rămâne esenţială pentru strategia de tratament, oferind date despre evoluţia şi prognosticul infarctului miocardic acut cu supradenivelarea segmentului ST (STEMI). Trialul a cuantificat modificările ischemo-lezionale (segmentul ST) şi de pierdere a masei miocardice (unda R) în intervalul optim de decizie terapeutică de 30 de minute. Metodologia – La 100 de pacienţi cu STEMI şi flux TIMI 0 sau 1 s-au măsurat: magnitudinea supradenivelării segmentului ST, respectiv amplitudinea undei R, în relaţie cu durata dintre debutul durerii coronariane și prezentare. Rezultate – Evoluţia magnitudinii segmentului ST în intervalul 0-30 min a fost variabilă (creştere 46,16%, staţionare 30,87%, scădere 22,96%). Evoluţia amplitudinii undei R a fost predominant de scădere (74,82%) sau de staţionare (25,18%). În intervalul optim de decizie terapeutică s-a stabilit o corelație semnificativă între magnitudinea segmentului ST (creşterea, staționarea sau scăderea) și scăderea amplitudinii undei R (r=0,45, p<0,0001, r=0,29, p<0,001 respectiv r=0,22, p<0,001). Concluzii – Analiza modificărilor undei R ar trebui inclusă în descrierea electrică a evoluţiei IMA în relaţie atât cu creşterea cât şi cu scăderea/staţionarea supradenivelării segmentului ST. O eventuală corelație între scăderea undei R și supradenivelarea segmentului ST ar semnifica evoluţia necrozei miocardice şi ar putea constitui un parametru suplimentar în indicaţia revascularizaţiei.
Cuvinte-cheie: segmentul ST; unda R; interval optim de decizie terapeutică; interval debut durere-prezentare
Introduction and Objectives
Cardiovascular conditions represent a major health issue having coronary artery disease as the most frequent pathology. Acute myocardial infarction (AMI) constitutes the main cause of death with maximum risk during the first hours1. Early diagnosis and identifying high-risk patients remain a real issue in clinical practice. Therefore, the development of diagnostic abilities led to permanent modifications concerning the AMI classification criteria. Electrocardiogram (EKG) still remains a landmark with regard to AMI diagnostic and prognosis, offering essential data while aiming to outline the optimal treatment strategy2.
The purpose of the study was to determine the ischemic lesions and loss of myocardial tissue in STEMI cases during the optimal therapeutic decision interval through “the looking glass” of EKG changes’ evolution.
Materials and methods
The present trial is based on a retrospective analysis which included patients admitted in the Cardiology Clinical Departments of Caritas, ”C.C Iliescu” Emergency Institute of Cardiovascular Disease and the Army Emergency Center of Cardiology between 2009 and 2010. The first inclusion criterion consisted of chest pain (prolonged pain for over 20 minutes, commonly having a retrosternal on epigastric location, which does not favorably respond to nitroglycerine administration) and EKG changes in accordance with the present guideline3 (ST segment elevation measured at the J point in 2 contiguous leads: ≥ 0.25 mV in men aged below 40 and ≥ 0.2 in those over 40; ≥ 0.15 mV in V2-V3 leads and/or ≥ 0.1 mV in other leads for women). Subsequent to angiography, patients with TIMI 0 and 1 flow were selected.
The exclusion criteria were represented by the presence of Q wave on the initial EKG, a history of myocardial infarction, intraventricular conduction disturbances, left ventricular hypertrophy (LVH), Killip grade III-IV heart failure, rescued ventricular tahiarytmia, echocardiographically visible ventricular aneurysm and angiographically established TIMI 2-3 flow.
During the course of the study, the selected series was analyzed with regard to demographics, medical history, associated co-morbidities and previous outpatient therapy. There were evaluated the time passed from the onset of chest pain to first medical exam, the EKG upon hospital admittance (moment M0) and 30 minutes later (moment M30). The 30 minutes interval is confirmed by the European Guideline as optimal for considering the revasularization therapeutic alternative3. There were determined the EKG related AMI location, the M0 and M30 magnitudes of the ST segment elevation as well as the R wave amplitude at the respective moments. In accordance with the Guideline3, in each EKG lead, the ST segment elevation was assessed at J point and the R wave amplitude at the vertical distance from baseline (defined as 2 PR consecutive intervals) to peak. The measurements were performed by 2 independent investigators.
The selected patients were divided into 3 subgroups in accordance with the time passed from the onset of chest pain to presentation as following: 0-3 hours (subgroup I), 3-6 hours (subgroup II), 6-12 hours (subgroup III).
Ecocardiography upon admittance was performed in all cases and determined useful parameters for evaluating the selection criteria (heart failure stage, the presence of ventricular aneurysm) such as the left ventricular ejection fraction (LVEF – Simpson biplane method) and the segmentary kinetics’ anomalies. Coronarography was applied at 60-120 minutes from diagnostic in 90% of the patients and after 2-5 days in 10% of the cases.
All included patients underwent percutaneous coronary intervention with stent placement and subsequently successful reperfusion (final TIMI-3 flow).
The statistical analysis performed using the STATISTICA 8.0 and EpiInfo 3.5.1. software. The outcomes were displayed as frequencies for the category variables (χ2 and Fischer tests) and as mean values (± standard deviation) for the numeric variables (Student t-test). The level for statistical significance was set at p value <0.05. The graphics were accomplished by the STATISTICA 8.0 and Microsoft Excel 2003 software.
Results
The study group included 100 patients with a mean age of 60.27 years. The most significant cardiovascular risk factors were represented by smoking, hypertension, dislipidemia and diabetes. The main associated co-morbidities were angina (present in the majority of cases – 85%), cardiac stents and chronic renal failure (Table 1, Figure 1).
Table 1. Patients’ characteristics
| Demographics | |
| Men | 77 (77%) |
| Women | 23 (23%) |
| Mean age | 60.27 (± 13) |
| Mean age in men | 60 (± 12.5) |
| Mean age in women | 60.7 (± 14.6) |
| Cardiovascular risk factors | |
| Smoking | 49 (49%) |
| Hypertension | 37 (37%) |
| Dislipidemia | 38 (38%) |
| Diabetes | 25 (25%) |
| Associated co-morbidities | |
| Angina | 85 (85%) |
| Previous stent angioplasty | 10 (10%) |
| Chronic renal failure | 5 (5%) |
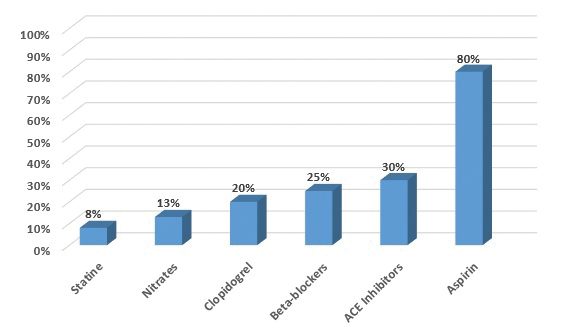
Figure 1. Previous outpatient medical treatment.
In the analyzed series, the location of the myocardial infarction process was anterior in 71% of the cases and inferior in 29%. The coronary arteries most commonly responsible for infarction were the left anterior descending coronary artery (65% of patients) and the right coronary artery (20%) (Figure 2).
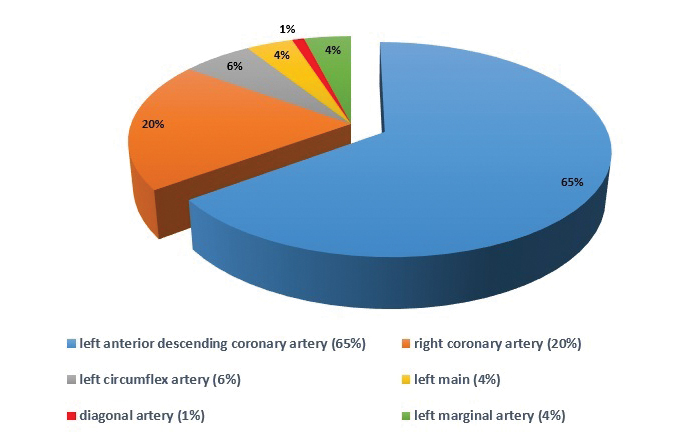
Figure 2. Coronary arteries responsible for infarction.
In relation with the time period from chest pain onset to presentation, subgroup III was found to include the largest number of cases (37%) followed by subgroup I (33%) and lastly by subgroup II (30%) (Figure 3).
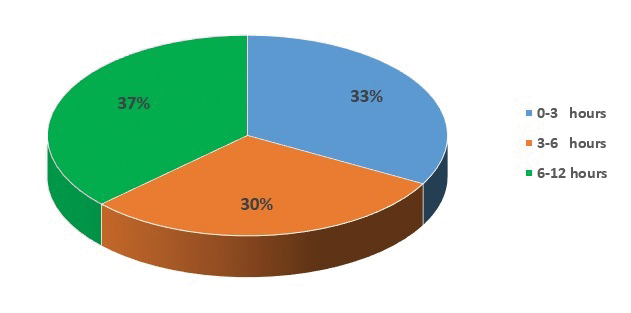
Figure 3. Series’ distribution according to presentation’ interval.
The analysis of the ST segment elevation increase revealed the highest proportion of cases characterized by this process in subgroup I (59.38%), followed by subgroup II (46.67%) and afterwards by subgroup III (32.43%). Consequently, it may be stated that the rise in ST segment elevation decreases progressively with the time length passed from chest pain onset to hospital admittance (Figures 4, 5).
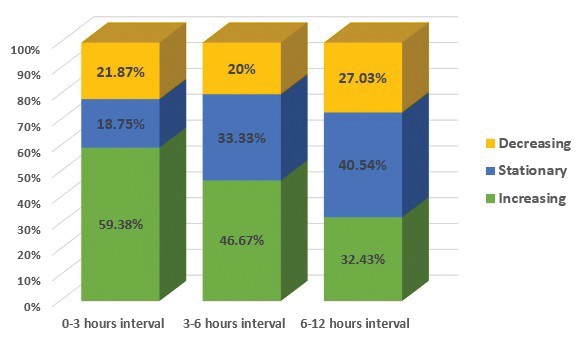
Figure 4. ST segment elevation magnitude in accordance with the chest pain onset.
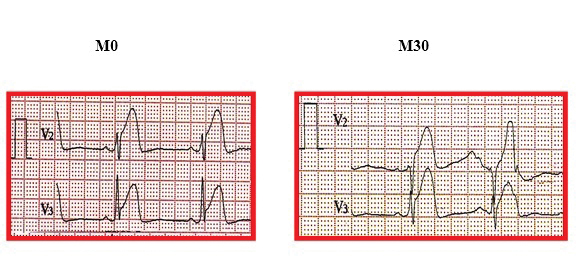
Figure 5. Increasing ST segment elevation magnitude during the 0-30 minutes’ interval.
From another point of view, it was observed that the R wave decreases mostly during the first 6 hours from chest pain onset (80.65% in subgroup I and 86.67% in subgroup II) by comparison to the delayed presentation study arm (6-12 hours – 57.14%). The rest of the patients were characterized by a stationary R wave amplitude (19.35%, 13.33% and 42.86% respectively) (Figures 6, 7). On the other hand, it was underlined the significant reduction of the R wave amplitude regardless of the evolution of the ST segment elevation in all of the 3 series.
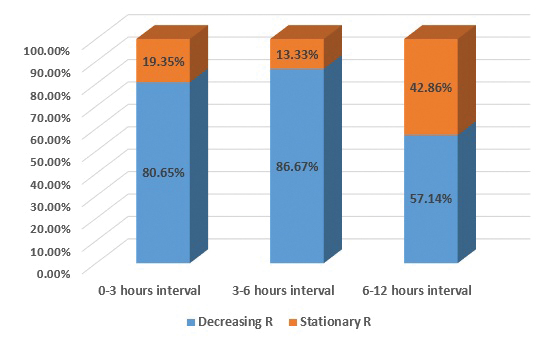
Figure 6. R wave amplitude variation related to the presentation interval.
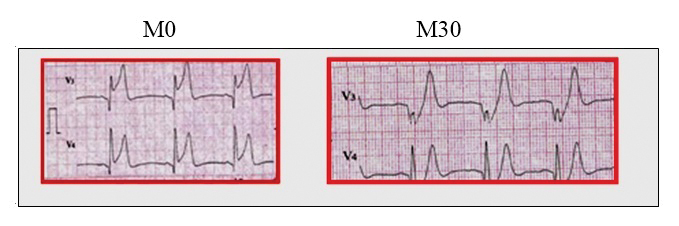
Figure 7. Decreasing R wave amplitude during the 0-30 minutes interval.
The EKG data analysis was focused on the increase, stationary evolution or reduction of the magnitude of the ST segment elevation while drawing a parallel with the R wave amplitude. The assessment of the respective outcomes particularly referred to the V1-V5, DII, DIII and aVF leads measured during the first 30 minutes from admission.
While summarizing the obtained results, it was showed that the R wave amplitude diminishes significantly and in an independent fashion when compared to variations specific for the ST segment elevation.
Taking into consideration the proportion of cases displaying an R wave amplitude reduction (74.82%) versus the stationary or decreasing ST segment elevation category (26.9%), variations regarding the R wave may be considered as a more dynamic parameter when assessing the STEMI related electric evolution from the perspective of pain – presentation intervals (Figure 8). Furthermore, the magnitude of the myocardial infarction process was suggested by the R wave voltage.
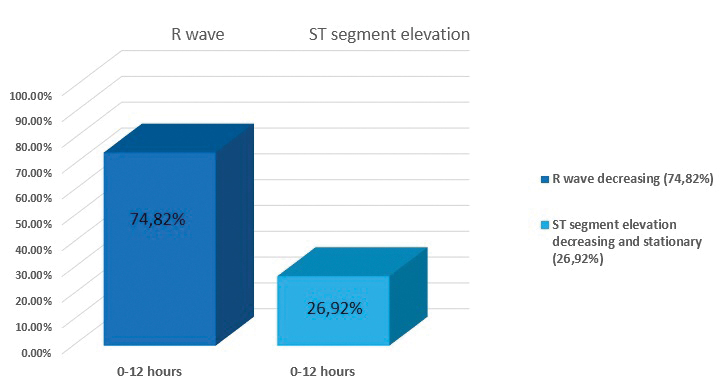
Figure 8. R wave and ST segment modifications up to 12 hours from pain onset.
The most statistically significant connection was able to be distinguished between the size of ST segment elevation (increase) and the R wave amplitude (decrease) (Figure 9). From the electro-physiologic point of view, this statistical correlation underlines the relationship between epicardial injury (ST segment) and myocardial viability (R wave) with regard to the myocardial necrosis’ evolution.
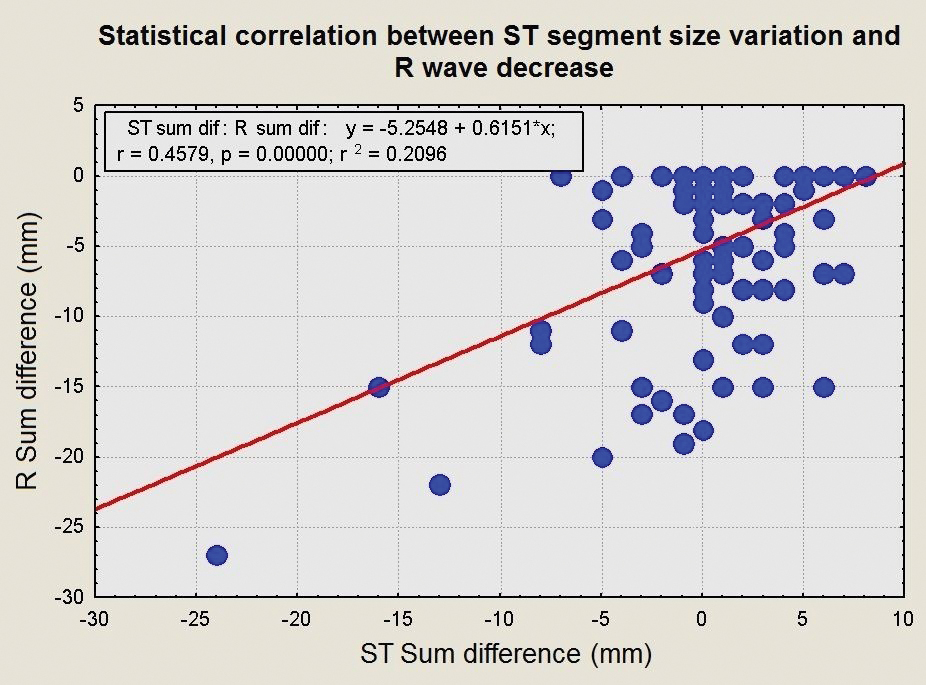
Figure 9. ST segment size variation and R wave decrease – statistical correlation.
During the optimal therapeutic decision interval, the correlation between the ST segment stationary evolution and the R wave amplitude decreasing tendency was r=0.29 (p<0.001). More over, concerning the ST elevation reduction correlated with the R wave decrease, the respective feature was r=0.22 (p<0.001).
From another point of view, 5% of the patients included in subgroup I, 25% of subgroup II and 60% of subgroup III also emphasized Q wave. Among these specific subcategories of patients, in subgroup I, 25% were cases of inferior and 40% of anteroseptal myocardial infarction, in subgroup II, 30% were cases of inferior and 50% of anteroseptal myocardial infarction and in subgroup III, 32% were cases of inferior and 59% of anteroseptal myocardial infarction. So, it could be underlined an important correlation between the occurrence of Q wave and the R wave amplitude reduction (r=0.59, p<0.001).
Discussion
Despite the fact that, during the past several years, STEMI patients’ treatment changed to including per primam invasive procedures, the certainty of the consequent results and prognostic of these therapies remained a challenge. Further along this line, EKG modifications related to myocardial injury as well as viability might be able to provide supplementary useful information concerning the clinical outcome.
It is widely acknowledged that, in a STEMI case, the ST segment elevation constitutes the most sensitive EKG marker. Some of the published trials showed that the ST segment elevation magnitude on the initial EKG represents a quite important predictive factor for the infarction size, thus proving useful during the process of risk stratification in STEMI patients immediately after hospital admission. The positive predictive value of ST elevation size could be further improved through correlations with symptoms, risk factors and clinical features4.
It was underlined that the infarction process’ dimensions are influenced by the ischemic risk area, duration of ischemia and the efficiency of the protective mechanisms (such as the antegrade residual blood flow and the collateral circulation). The impact of the initial ST magnitude over the accurate assessment of the infarction size during the invasive therapy is not yet fully understood and does require further research5.
The present trial followed the evolution of ischemic injuries and concomitant myocardial mass losses while focusing on their EKG profile. It was proven that the ST segment amplitude during coronary occlusion (0 to 30 minutes’ interval) displays a substantial variability, thus reflecting the duration of the chest pain episode. The largest increase of the ST segment elevation was determined during the 0 to 3 hours’ interval. This feature diminished progressively with prolonging time length from debut to presentation.
More over from this perspective, the literature data emphasized the fact that the ST segment amplitude reaches a maximum at approximately 1 hour from the chest pain onset. Afterwards, the respective elevation began to decrease and eventually became constant after an average period of 12 hours. This plateau is then followed by a gradual decline over the next few weeks4, 6. According to another published trial, the ST elevation returns to isoelectrical line within 2 weeks for 95% of patients with inferior STEMI location and for 40% subsequent to the anterior STEMI4,7.
The increase in ST segment elevation is known to represent proof of myocardial lesion’ evolution, while the 0 to 3 hours interval is most likely the optimal period for applying revascularization therapy. From another point of view, a decrease in ST magnitude or its’ stationary profile during the very same 0-3 hours moment could be related to either the progress or limitation of the myocardial necrosis phenomenon. In light of the present clinical research, the answer to this dilemma may be provided by a concomitant analysis of the ST elevation together with the R wave amplitude.
As far as the R wave is concerned, the available data confirmed its’ amplitude as a myocardial injury’ severity marker in direct correlation with the degree of myocardial viability8. Usually, this feature has been assessed by means of pharmacologic stress echocardiography or myocardial scintigraphy. However, some studies outlined a significant correlation between the imagistically confirmed myocardial viability and the R wave voltage variation in AMI cases9. Myocardial activation subsequent to the depolarization phenomenon is relatively maintained in lesions limited to the level of the endocardium or epicardium, while the R wave amplitude slightly decreases10. Time dependent ischemia progression leading towards the development of transmural lesions is associated with myocardial activity reduction and a significant decrease in the R wave amplitude9,11.
There were reported data regarding the diagnostic and prognostic value of EKG modifications in cases of developed infarction. A recent study on non-human primates analyzed the several EKG features including the ST elevation as well as the R wave in different stages of ischemia12. The ligation of the left anterior descending artery was performed at different levels, thus resulting in various sizes of the ischemic/infracted tissue area. It was noticed that R wave amplitude changes correlated with the dimension of the myocardial infarction both during the early as well as the late stage of the coronary occlusion experiment12.
Consequently, it became possible to establish the magnitude of the viable tissue by comparison to the irreversibly compromised myocardium by measuring the R wave changes. The authors concluded that these precocious predictive factors may help in making preventive or precautious decisions aimed towards minimizing the risk of developing a severe AMI12.
Although the reversibility of the R wave voltage according to the precordial leads in AMI patients during the post-revascularization period gathered a significant amount of interest, the electro-physiological mechanisms behind the R wave voltage variation were not yet fully understood. On the other hand, there were discovered substantial correlations between rises in R voltage and the amelioration of left ventricular function or improvements concerning the scintigraphic parameters. After revascularization, in cases of anterior AMI, the reversibility of the R wave was able to reflect the presence of myocardial viability9.
The available data evaluating the post-angioplasty R wave amplitude in STEMI patients confirmed it as a reliable predictive marker with regard to the short term prognostic for major adverse clinical events, thus outlining a remarkable clinical impact. From this perspective, an R wave amplitude decrease according to precordial leads was associated with low LVEF and higher heart failure degree. This aspect may be seen as demonstrating the possible use of R wave amplitude during risk stratification for this particular category of patients8.
In light of the present findings, the R wave evolution within the optimal treatment choice period displayed a predominantly decreasing tendency regardless of the pain onset – hospital presentation time length. On the other hand, the previously proven R wave amplitude reduction suggested progression in the myocardial necrosis process8. Therefore, the issue of an eventual correlation between the R wave reduction and the ST elevation increase became obvious and possibly suggesting a necrosis’ evolution.
Based on these premises, a thorough analysis of R wave modifications might become suitable for being included in the electric description of AMI evolution while preserving a direct relation not only with the ST segment elevation rise but also with its’ decrease or constant levels. In this regard, it may be considered as relevant the fact that an R voltage reduction was determined in the majority of included patients (74.82%), uninfluenced by whether the ST segment size decreased or remained the same.
As far as the study limits are concerned, there may be underlined several aspects eventually leading to voltage measurements’’ alterations. Among these, there are to be considered the subjectivity of time intervals’ evaluation by the patient (possibly unsure period from pain onset to presentation), the presence of extra-cardiac factors and the association of non-occlusive coronary injuries.
While looking towards the future, it may become useful to quantify the salvaged myocardium subsequent to the revascularization therapy in cases of decreasing R wave amplitude versus patients lacking any R change during the optimal treatment time window.
Conclusions
Initial EKG at hospital admission constitutes the main landmark while evaluating the myocardial necrosis’ size and evolution as well as the time length of the coronary occlusion related pain episode. Changes in the ST segment magnitude during the 0-30 minutes’ interval is rather variable, thus reflecting the chest pain episode’ duration. The positive predictive value of the ST segment elevation may be further improved by correlating it to the R wave amplitude reduction. In the present study, it was emphasized a significant R wave voltage decrease, even under the circumstances of increasing or stationary evolution of the ST segment elevation. This finding demonstrates that the R wave may be regarded as a remarkably dynamic parameter while aiming to assess the AMI specific electric evolution.
Under these circumstances, the analysis of R wave modifications (confirmed myocardial viability marker) may be considered as a potentially relevant aspect when aiming to obtain an accurate electric description of STEMI evolution. This perspective might be related not only to increases of the ST segment elevation but also to its’ possible stationary or decreasing variation. Based on these premises, the ST segment changes associated with the R wave amplitude reduction during the optimal therapeutic decision’ interval might suggest the progress of myocardial necrosis.
Conflict of interests: none to declare.
References
1. Savonitto S, Ardissino D, Granger CB, Morando G, Prando MD, Mafrici A, Cavallini C, Melandri G, Thompson TD, Vahanian A, Ohman EM, Califf RM, Van de Werf F, Topol EJ. Prognostic value of the admission electrocardiogram in acute coronary syndromes. JAMA. 1999 Feb 24;281(8):707-13.
2. Ripa MS. The ECG as decision support in STEMI. Dan Med J. 2012 Mar; 59 (3): B4413.
3. Task Force on the management of ST-segment elevation acute myocardial infarction of the European Society of Cardiology (ESC), Steg PG, James SK, Atar D, Badano LP, Blömstrom-Lundqvist C, Borger MA, Di Mario C, Dickstein K, Ducrocq G, Fernandez-Aviles F, Gershlick AH, Giannuzzi P, Halvorsen S, Huber K, Juni P, Kastrati A, Knuuti J, Lenzen MJ, Mahaffey KW, Valgimigli M, van ‘t Hof A, Widimsky P, Zahger D.ESC Guidelines for the management of acute myocardial infarction in patients presenting with ST-segment elevation. Eur Heart J. 2012 Oct; 33(20): 2569-619.
4. Nable JV, Brady W. The evolution of electrocardiographic changes in ST-segment elevation myocardial infarction. Am J Emerg Med. 2009 Jul;27(6):734-46.
5. Kurisu S, Inoue I, Kawagoe T, Ishihara M, Shimatani Y, Mitsuba N, Hata T, Nakama Y, Kisaka T, Kijima Y. Impact of the magnitude of the initial ST-segment elevation on left ventricular function in patients with anterior acute myocardial infarction. Circ J. 2004 Oct; 68(10):903-8
6. Essen R, Merx W, Effert S. Spontaneous course of ST segment elevation in acute anterior myocardial infarction. Circulation. 1979 Jan; 59(1):105-12.
7. Mills RM Jr, Young E, Gorlin R, Lesch M. Natural history of ST segment elevation after acute myocardial infarction. Am J Cardiol. 1975 May;35(5):609-14.
8. Tsai TH, Sun CK, Chung WJ, Lin YC, Leu S, Hussein H, Chen YL, Chung SY, Chai HT, Chua S, Fu M, Yip HK. Prognostic value of R wave voltage in patients with anterior wall STsegment elevation myocardial infarction undergoing primary percutaneous coronary intervention. Int Heart J. 2010;51 (5) : 325-30.
9. Isobe S, Okada M, Ando A, Nanasato M, Nonokawa M, Izawa H, Kondo T, Hirai M, YokotaM, TanahashiY, SaitoH. Clinical significance of changes in electrocardiographic R-wave voltage on chest leads in patients with acute anterior myocardial infarction. J Electro-cardiol. 2002 Jul;35 (3): 173-80.
10. Nanea I.T., Ginghină C., Ţintoiu I., Gheorghe G., Cristea A., Almarichi S., Onceanu S., Hodorogea A. Evoluţia supradenivelărilor segmentului ST din infarctul miocardic acut în intervalul optim de decizie terapeutică – date preliminare. Foaie de Informare Medicala. 2011 Aprilie; 24: 19-26.
11. Isobe S, Takada Y, Ando A, Ohshima S, Yamada K, Nanasato M, Unno K, Ogawa T, KondoT, IzawaH, IndenY, HiraiM, MuroharaT. Increase in electrocardiographic R-waves after revascularization in patients with acute myocardial infarction. Circ J. 2006 Nov; 70(11):1385-91.
12. SunX, CaiJ, FanX, HanP, XieY, ChenJ, XiaoY, KangYJ. Decreases in electrocardiographic R wave amplitude and QT interval predict myocardial ischemic infarction in Rhesus monkeys with left anterior descending artery ligation. PLoSOne. 2013Aug 13;8(8):e71876.
 This work is licensed under a